AI-driven polymer synthesis & design platform
Background

Customer Request
Challenges & Solutions
Challenges
Complex and outdated workflow
To run a simulation, customers had to edit huge text files and type commands in the terminal. The process was slow and easy to mess with.
Unflexible and inconsistent configuration
Because each simulation type required many unique parameters and dependencies, the setup forms became too long and complex, without adapting dynamically to the user’s needs.
No visualization & progress tracking
Simulation results were only available in raw tables and static graphs. There were no real-time feedback, no centralized dashboard, and no functionality to stop or adjust a simulation mid-process.
Solutions
Web UI over the Fortran engine
We built a middleware layer (user-friendly UI) that processes input & output data, launches simulations remotely, and collects the results. Users interact only with the web application, without touching the command line.
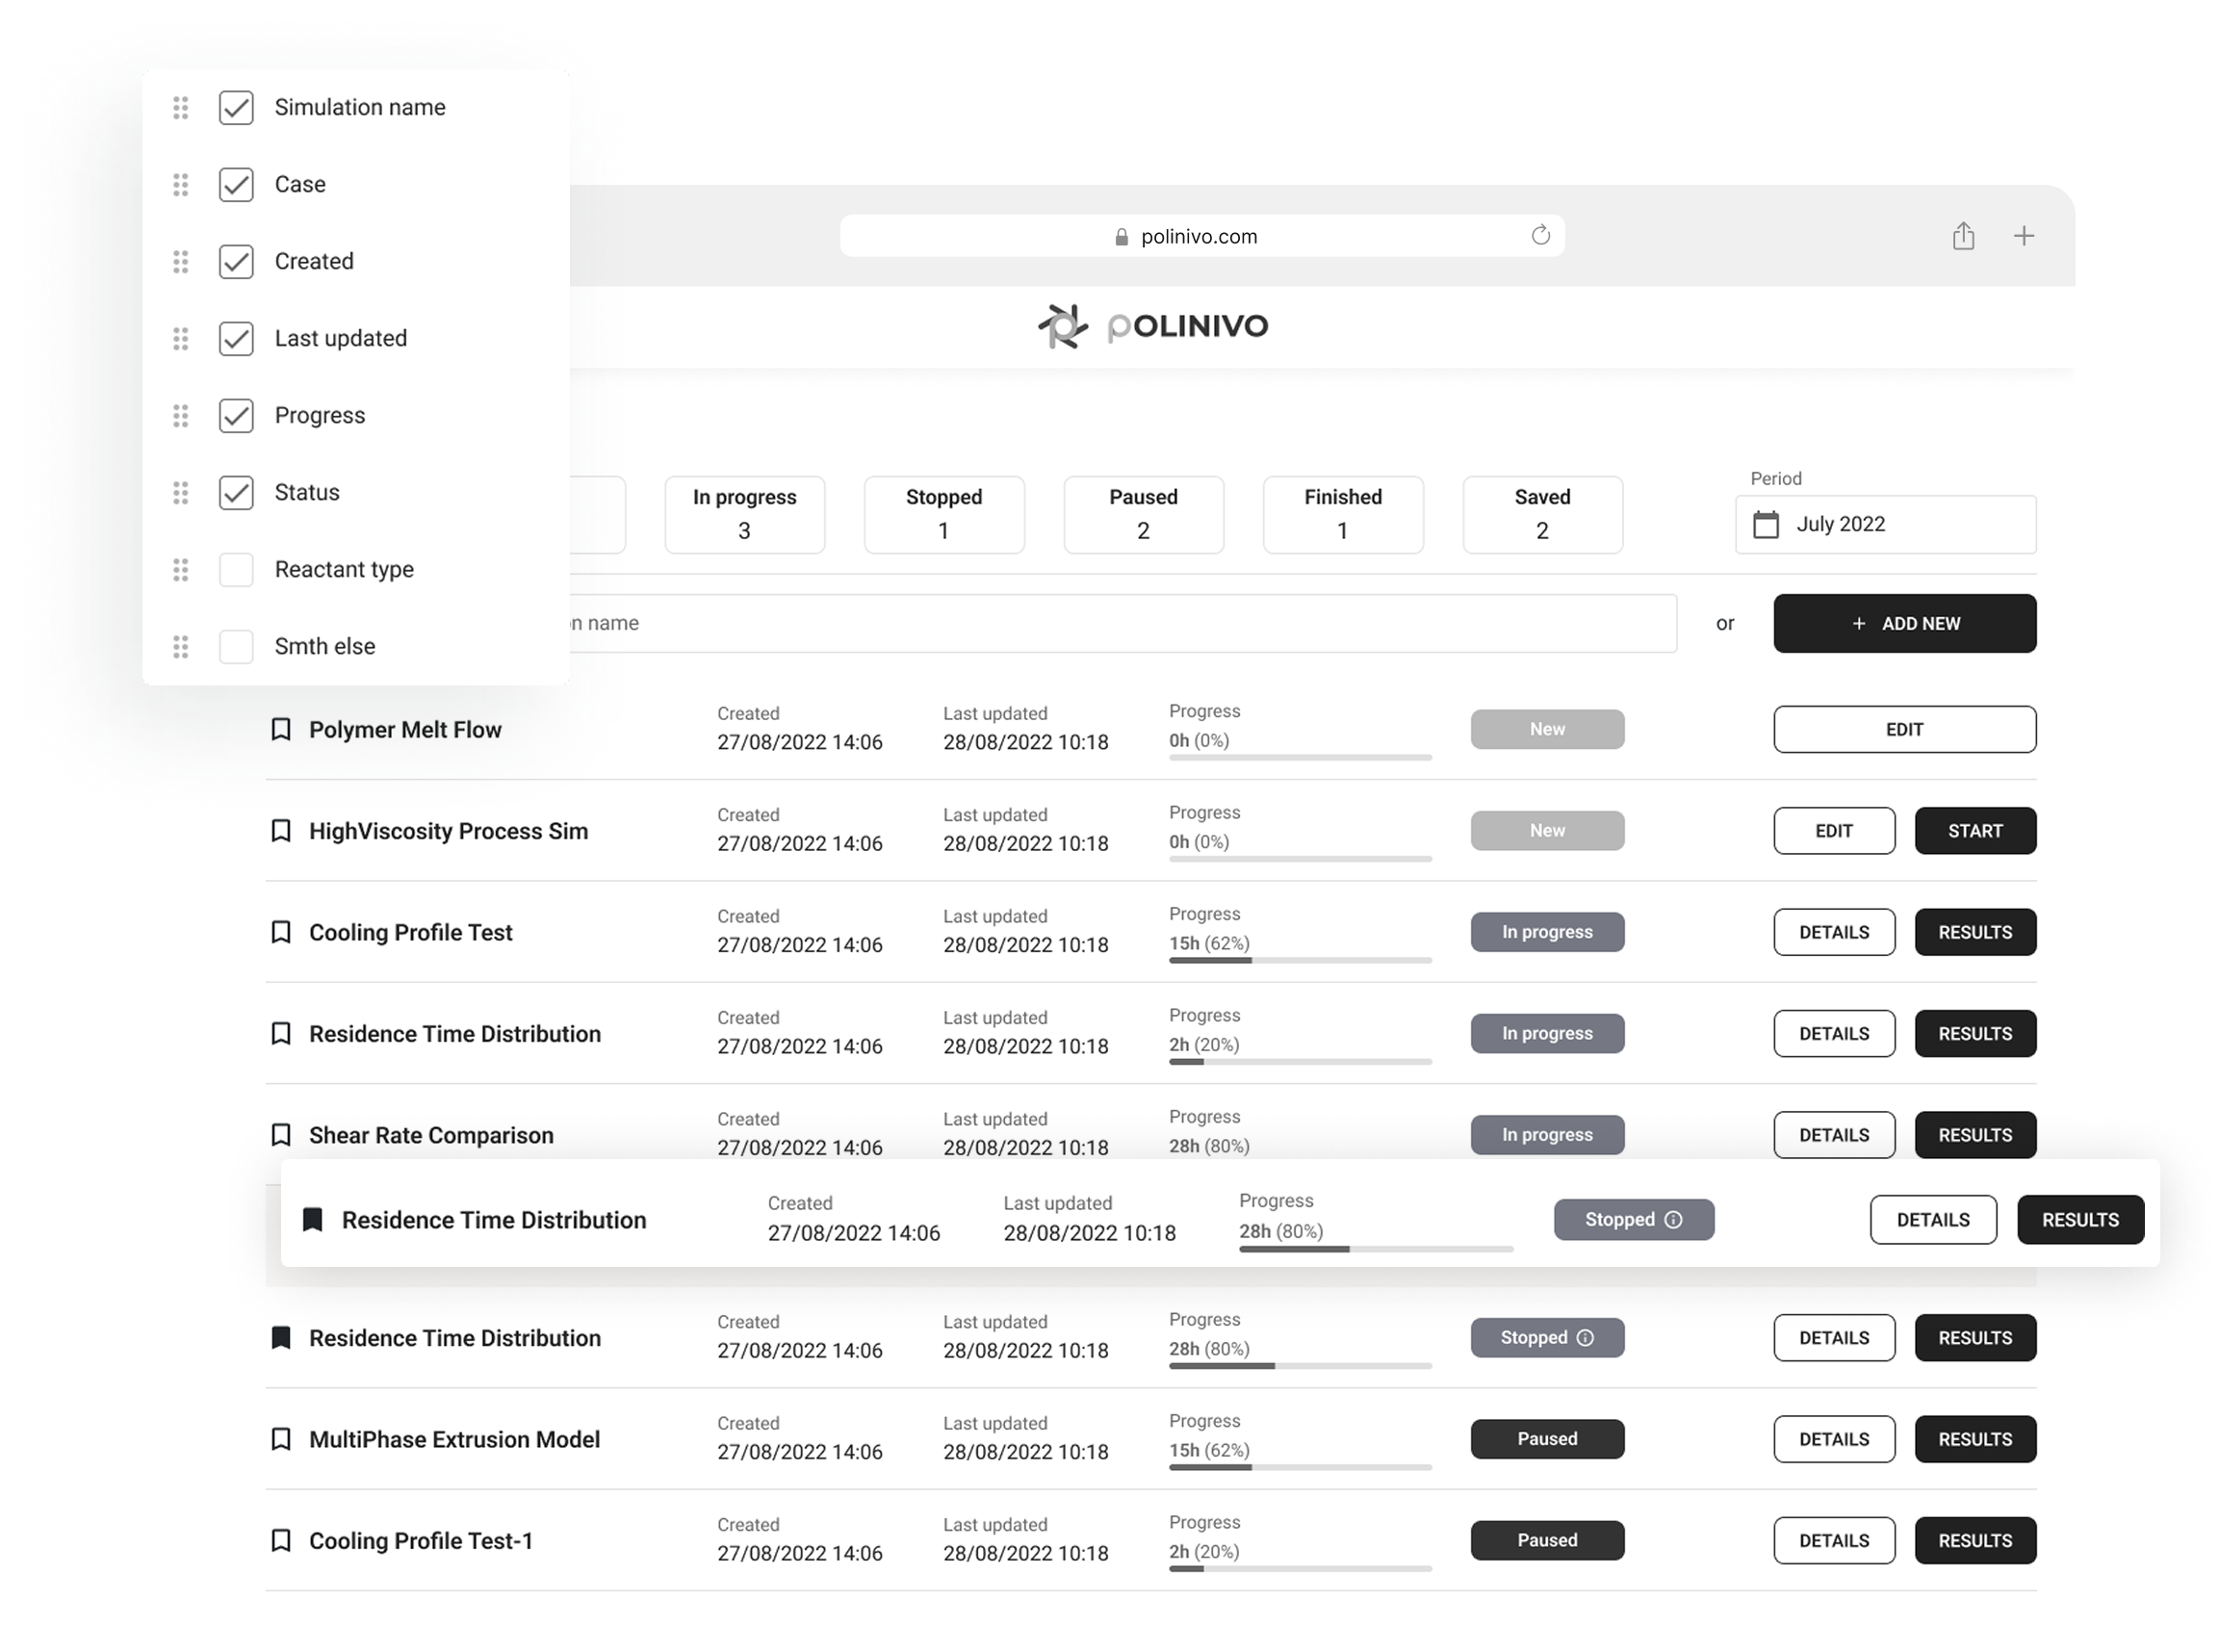
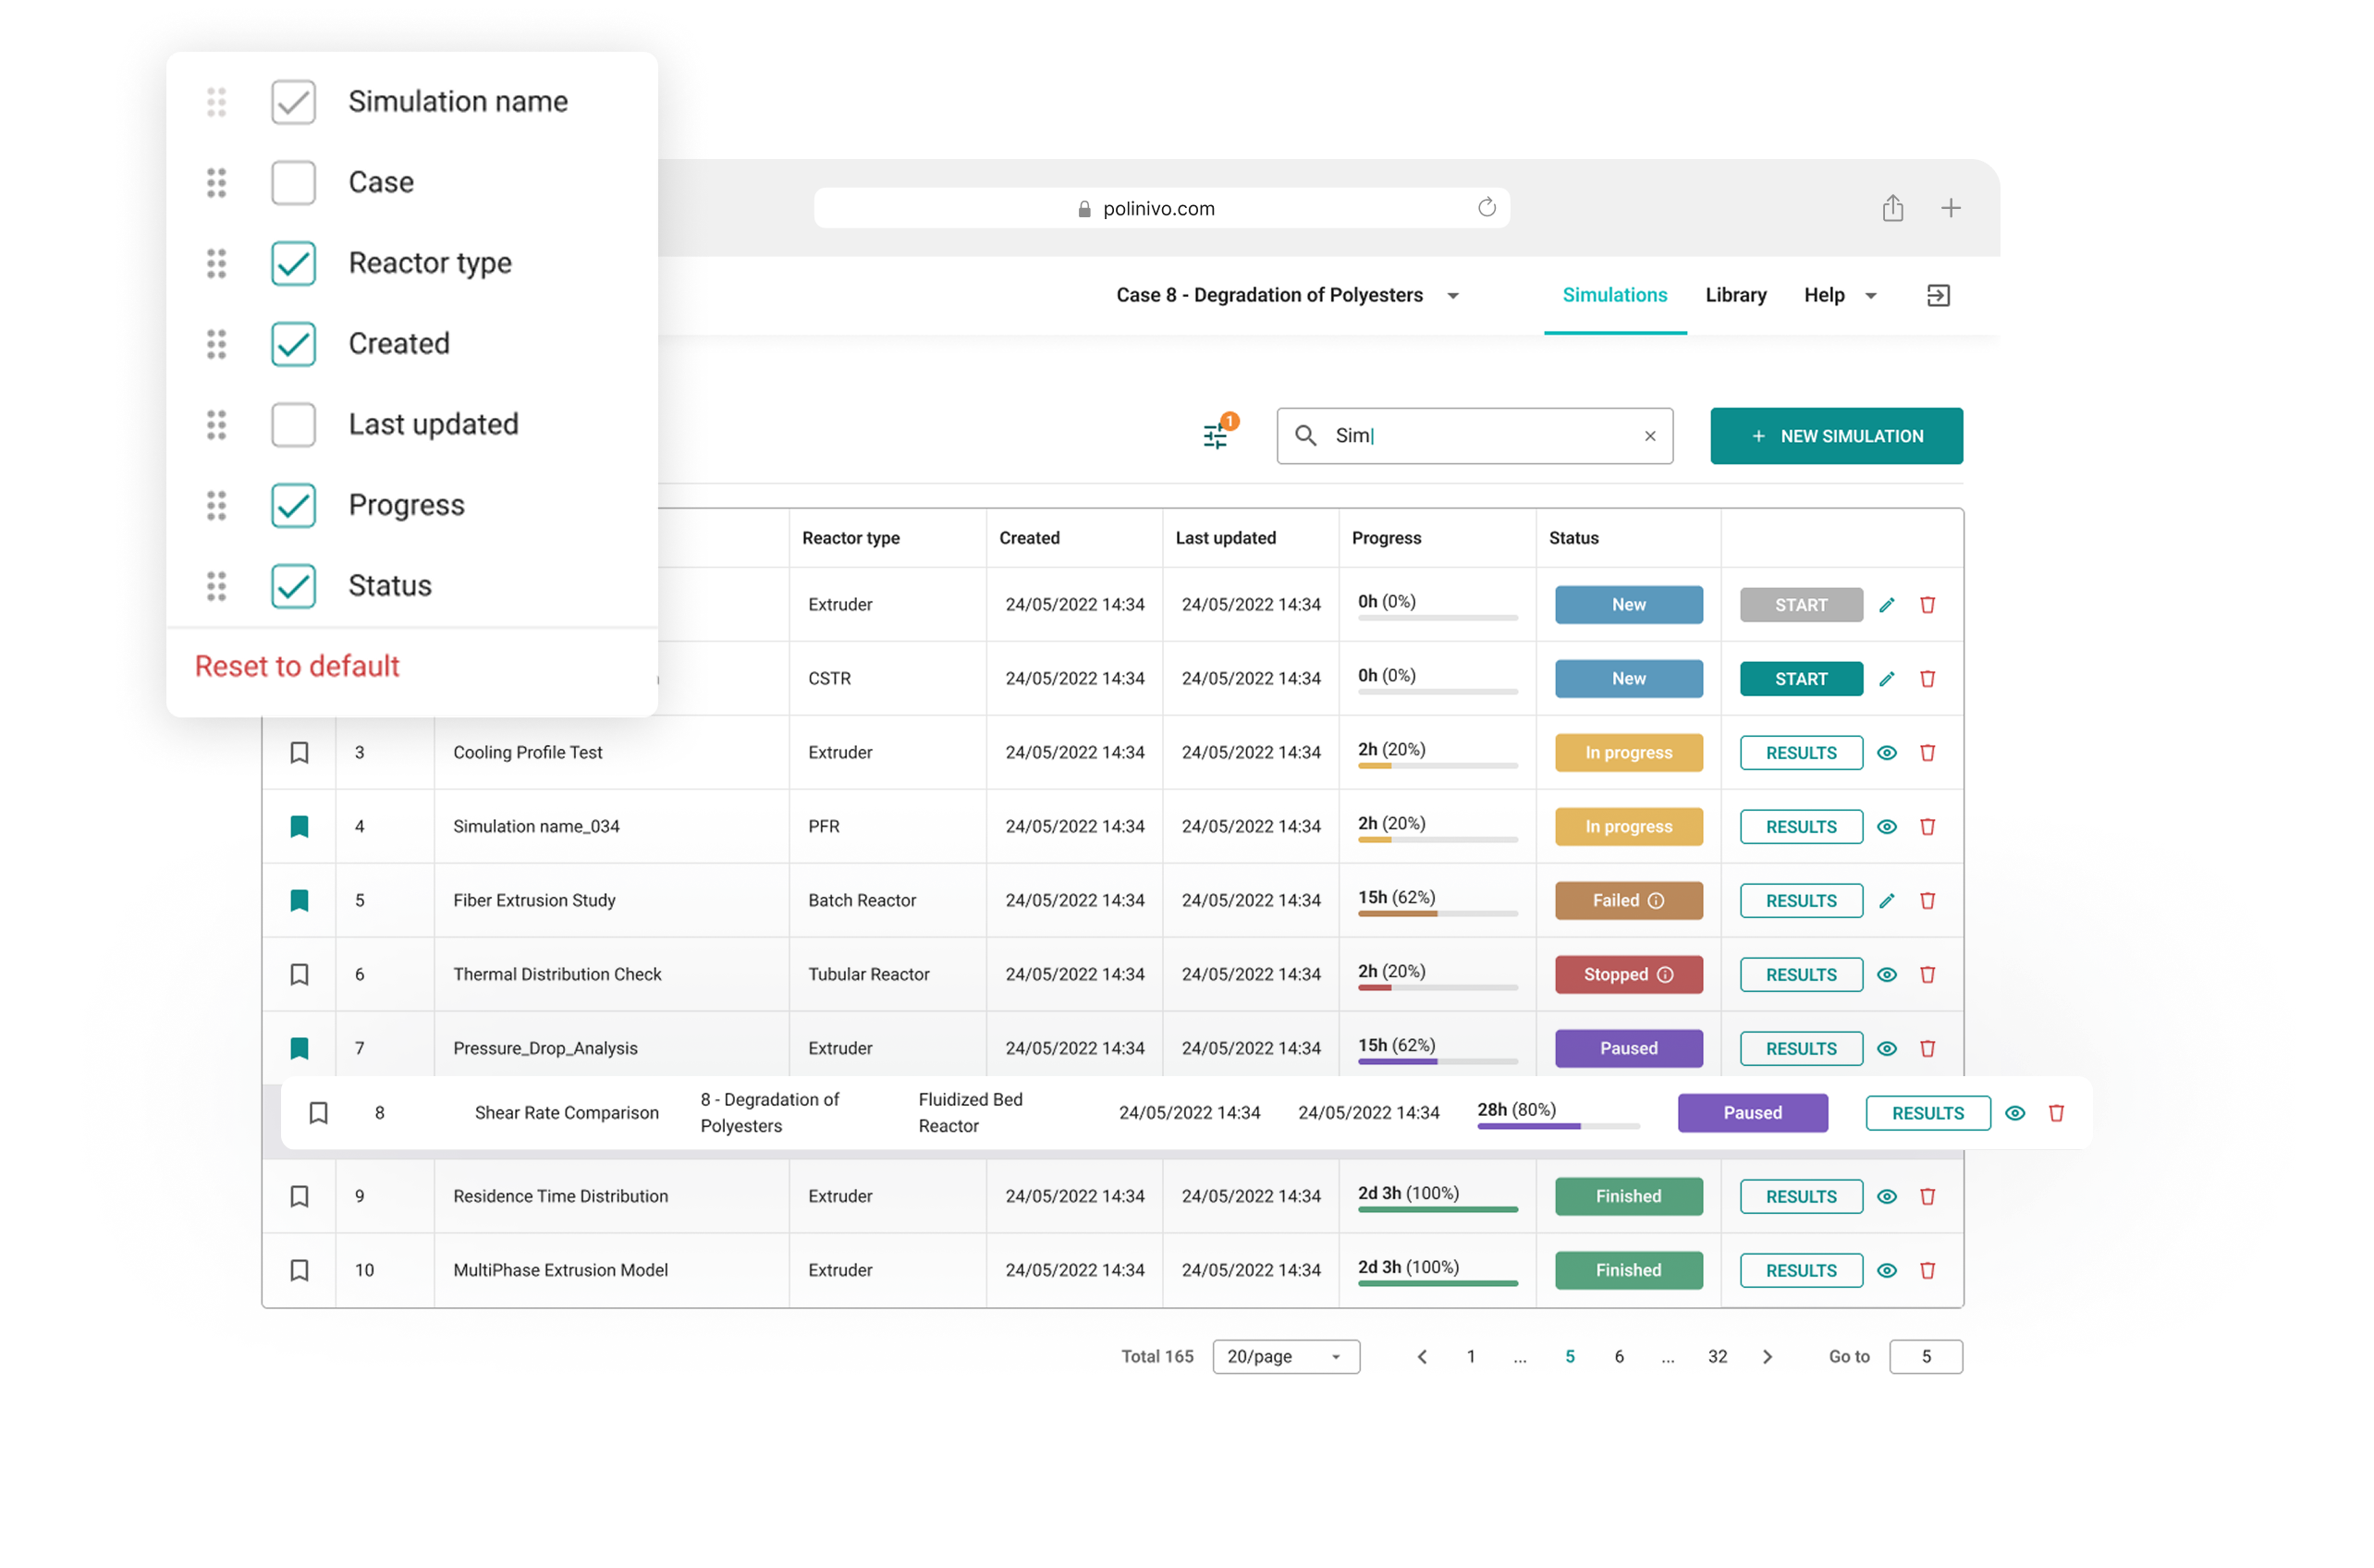
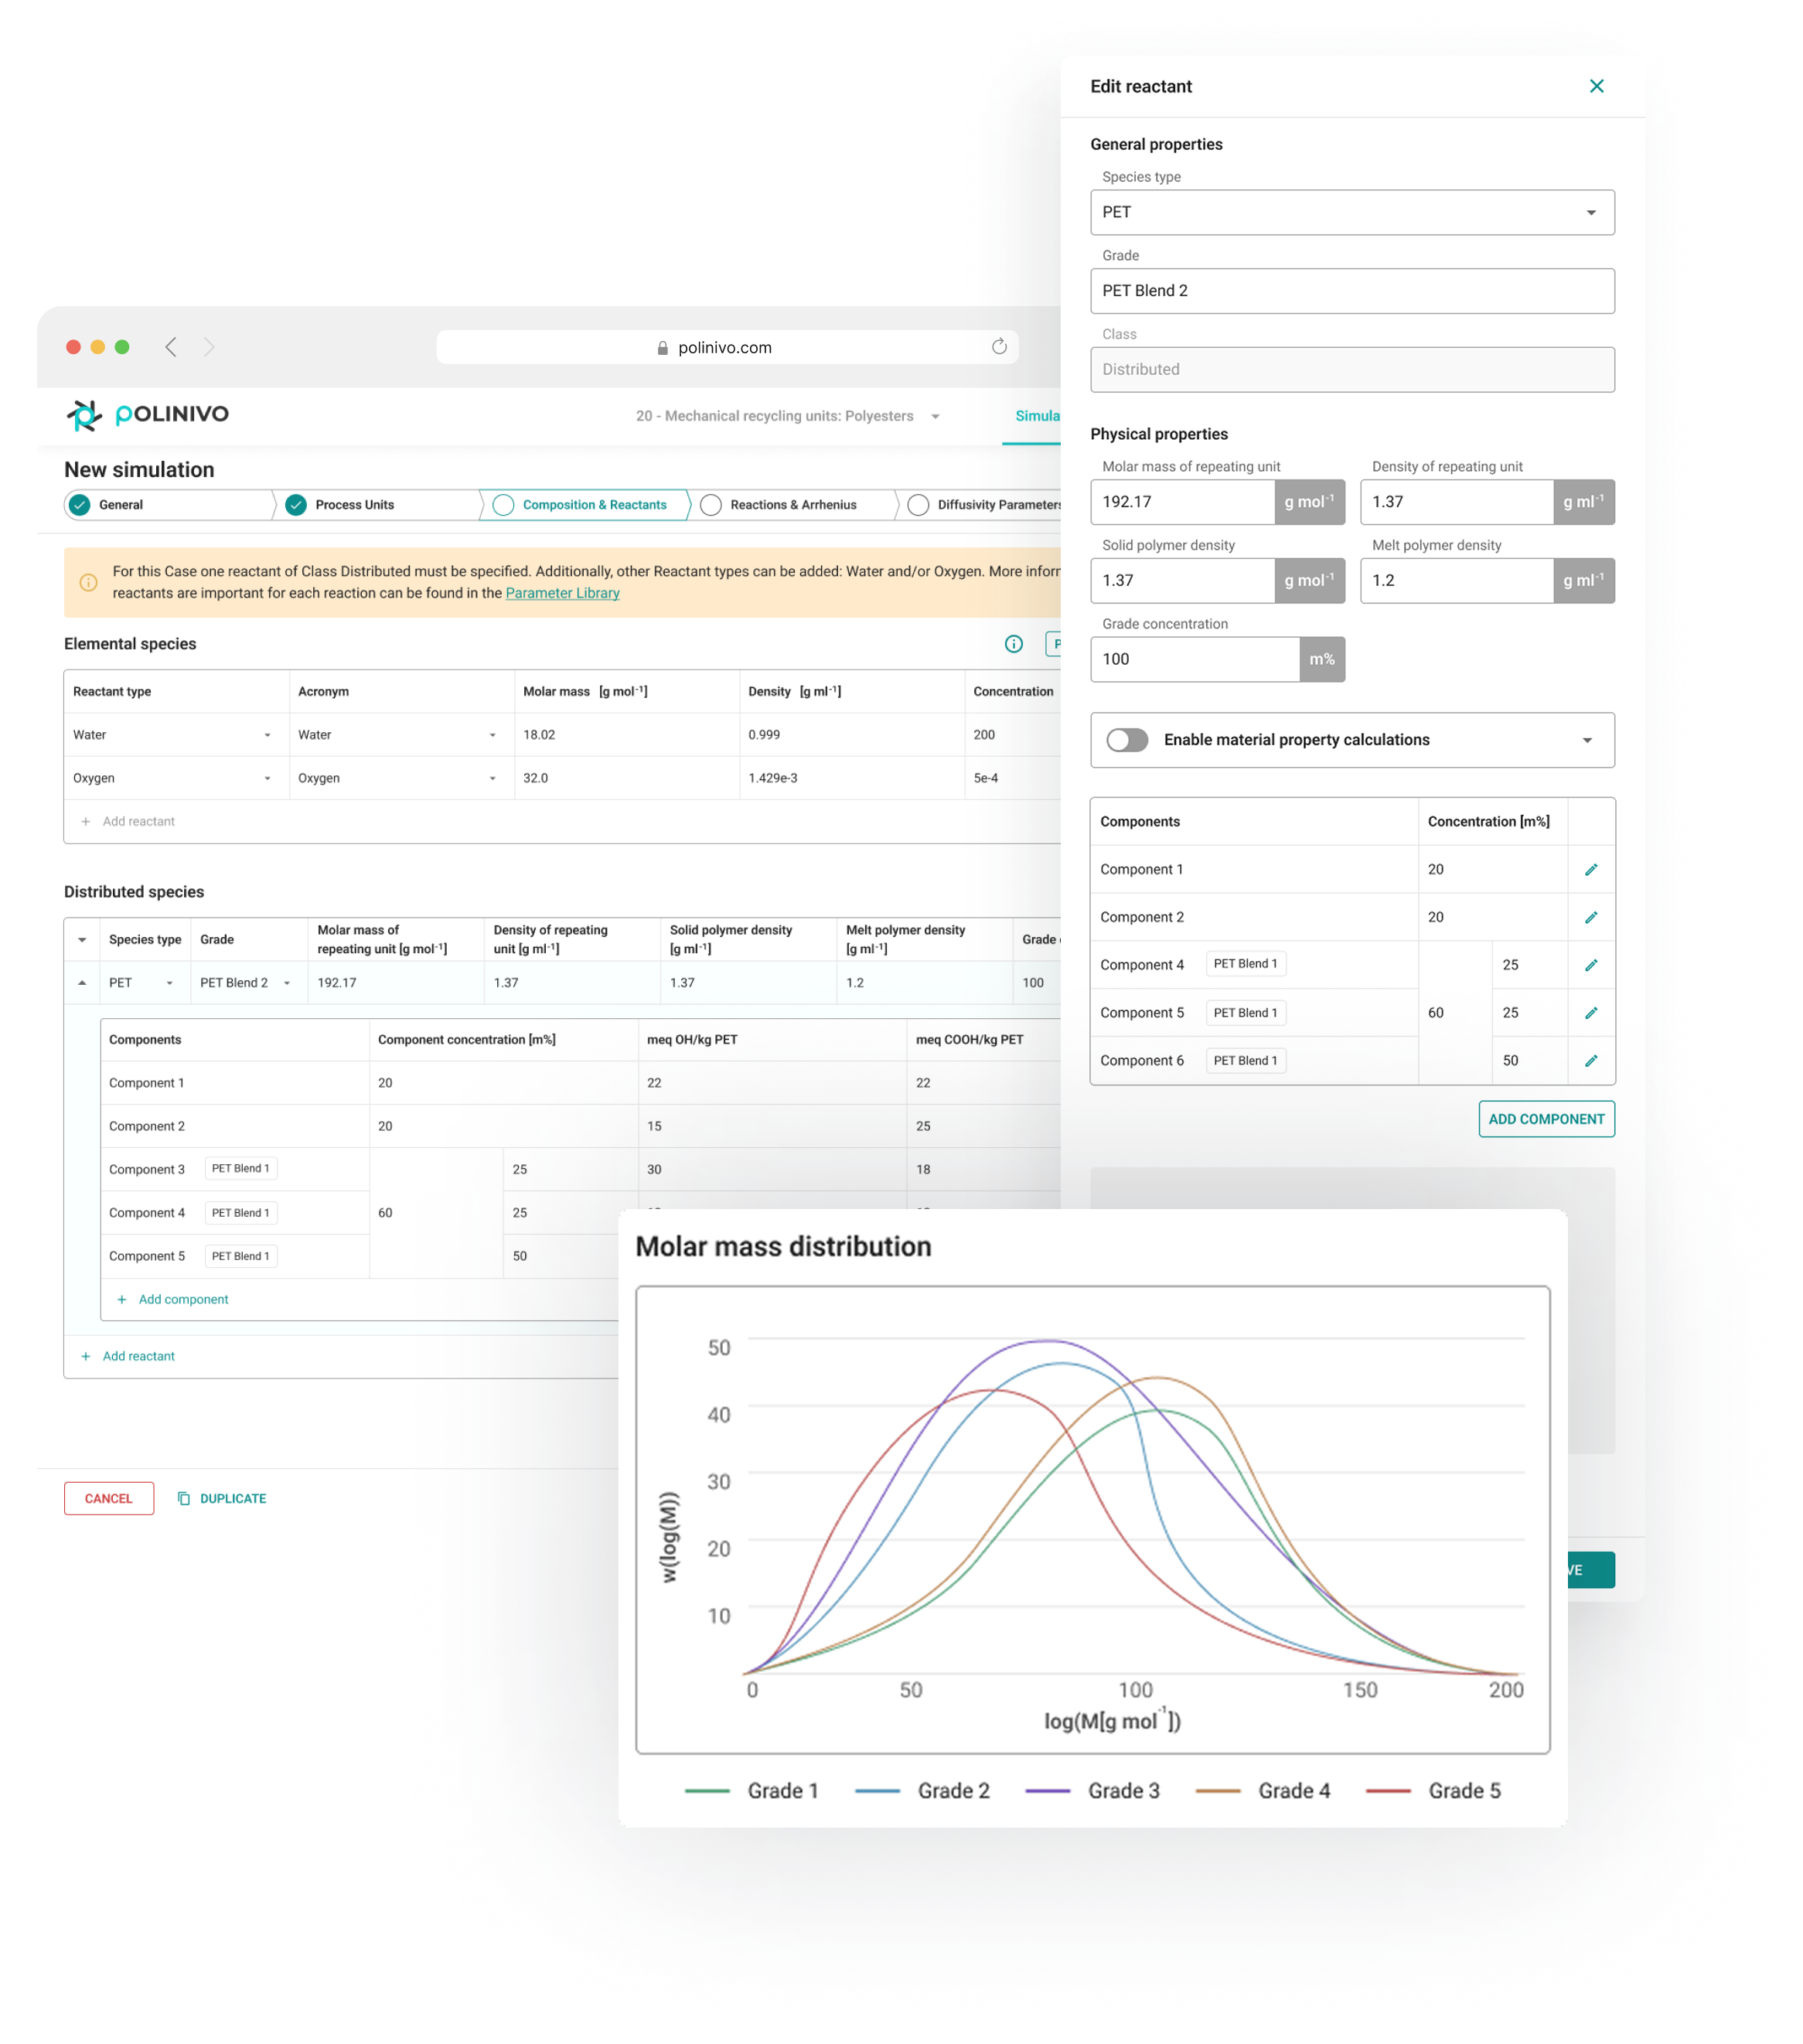
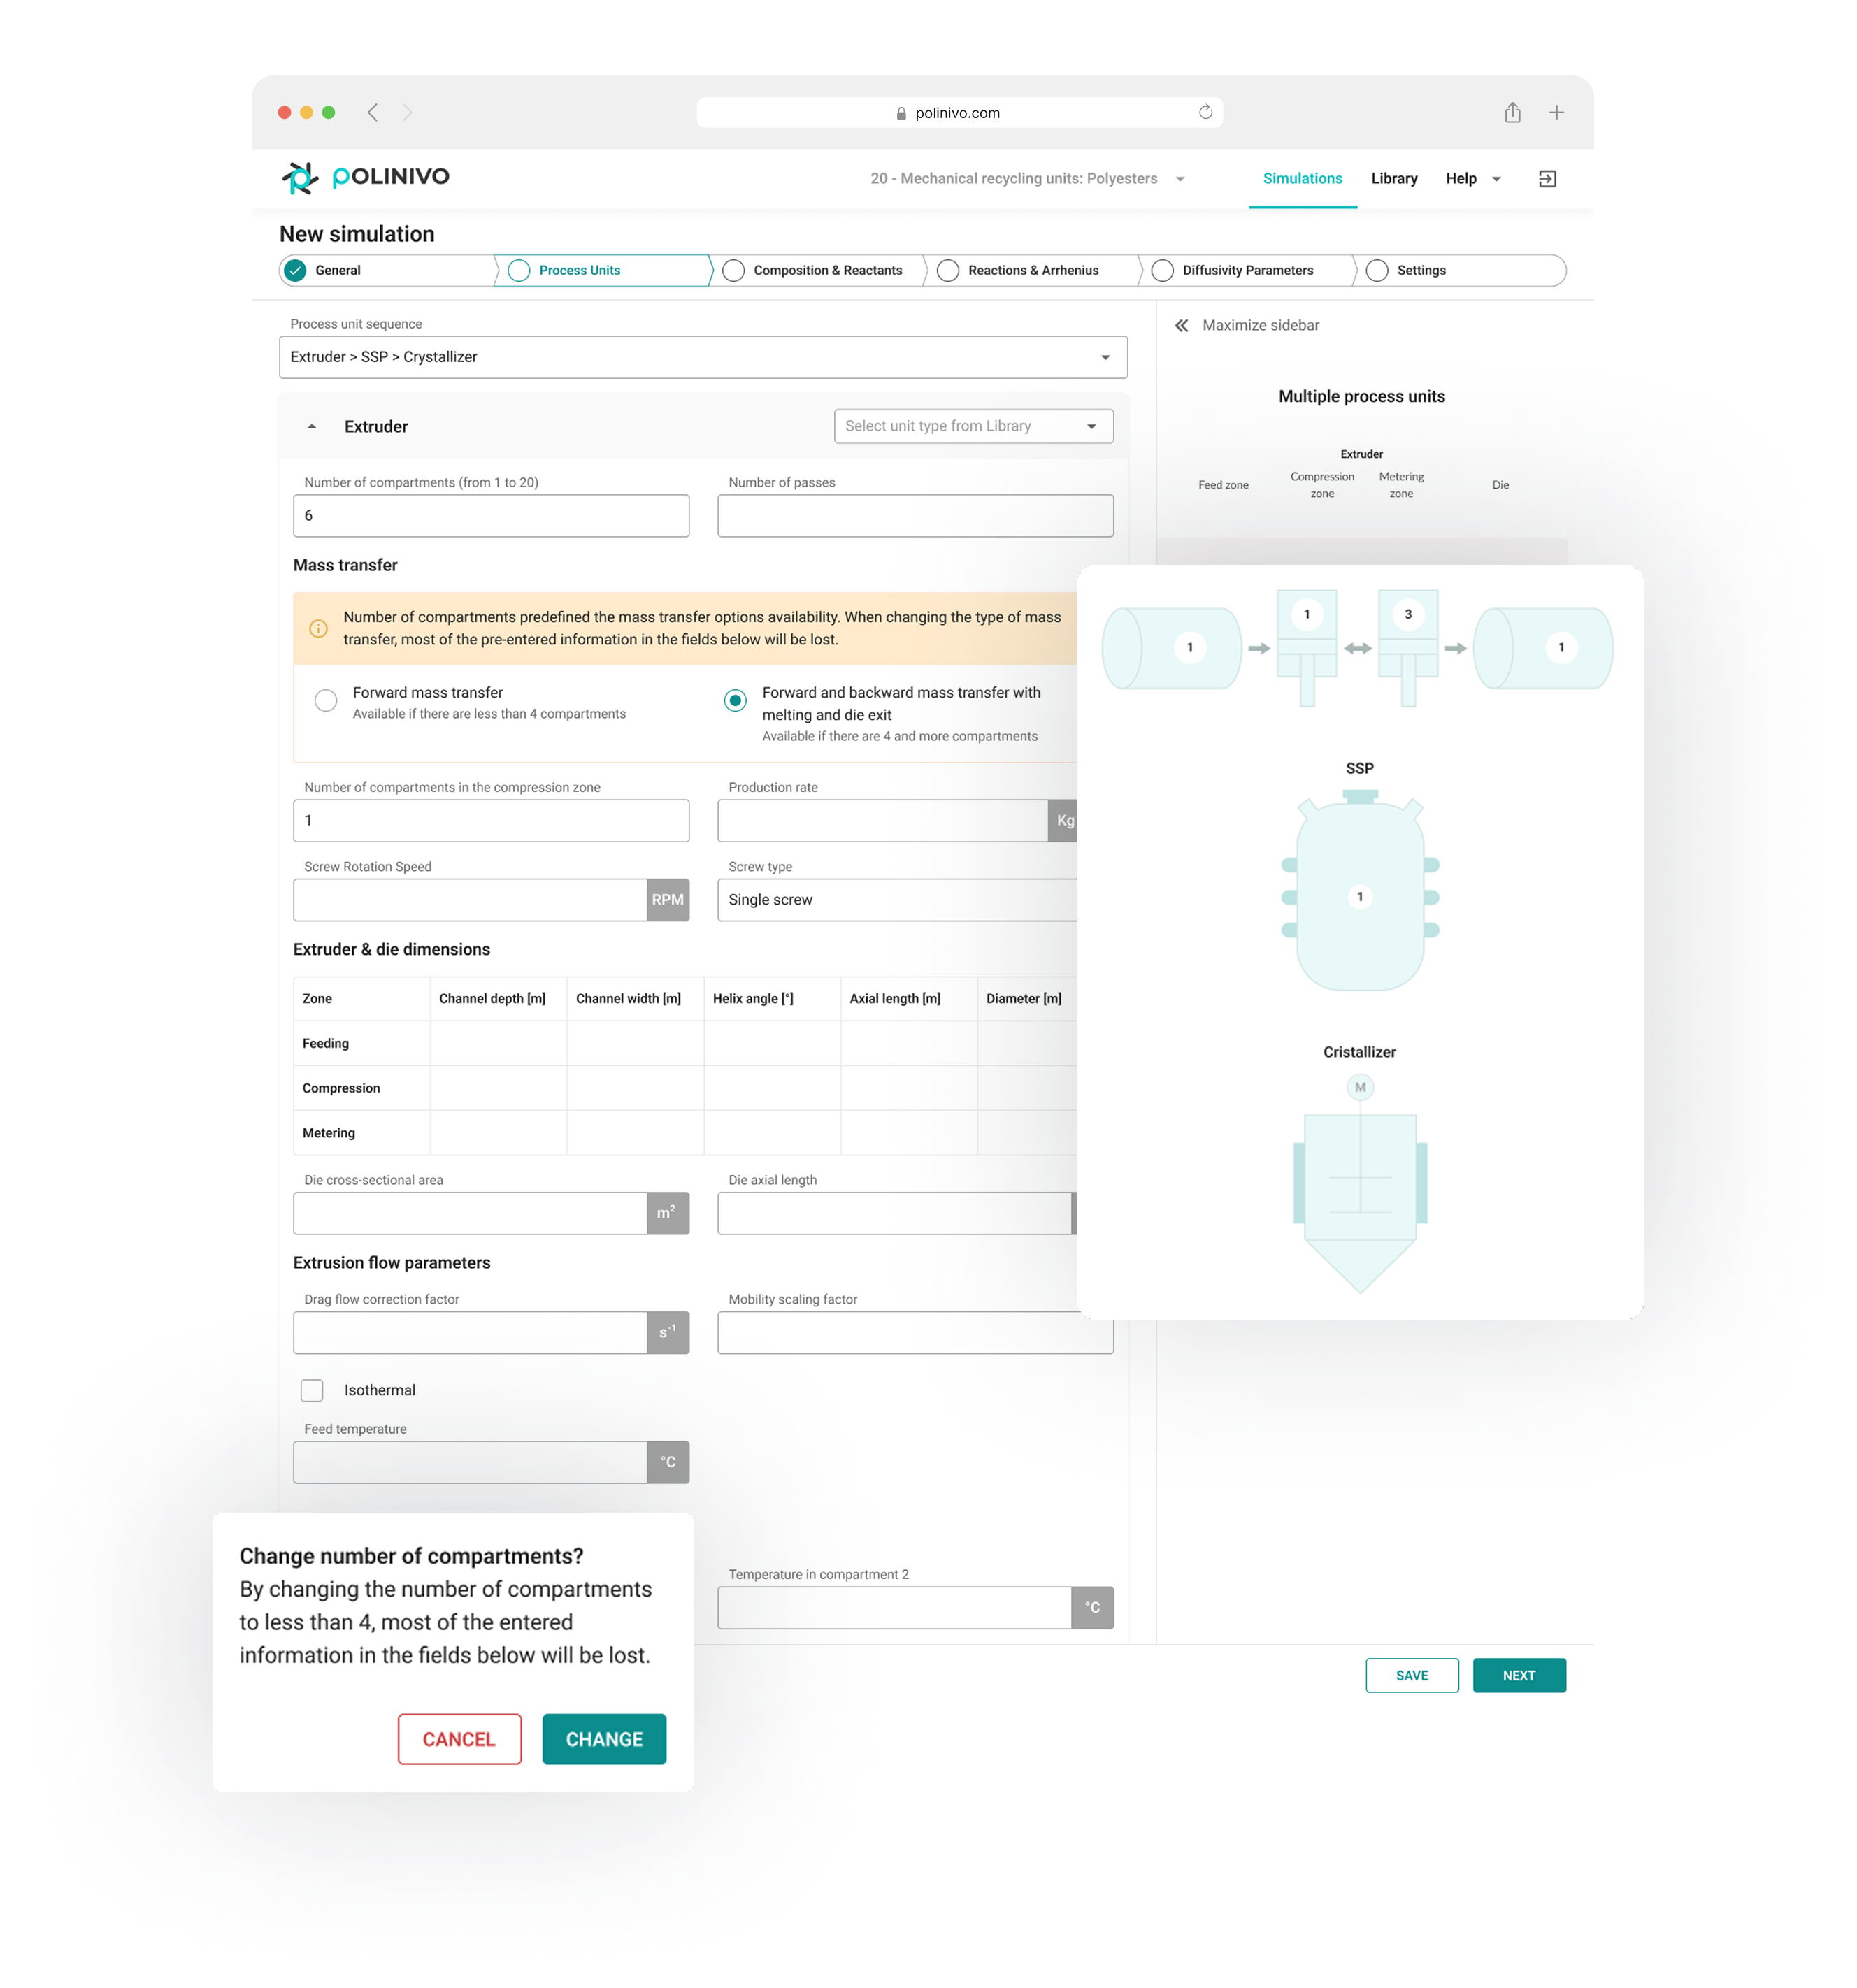
Configurable dynamic forms
We created a flexible form system that adjusts to each simulation type and changes dynamically depending on the user’s input. This allows quick setup of new cases and easy scaling.
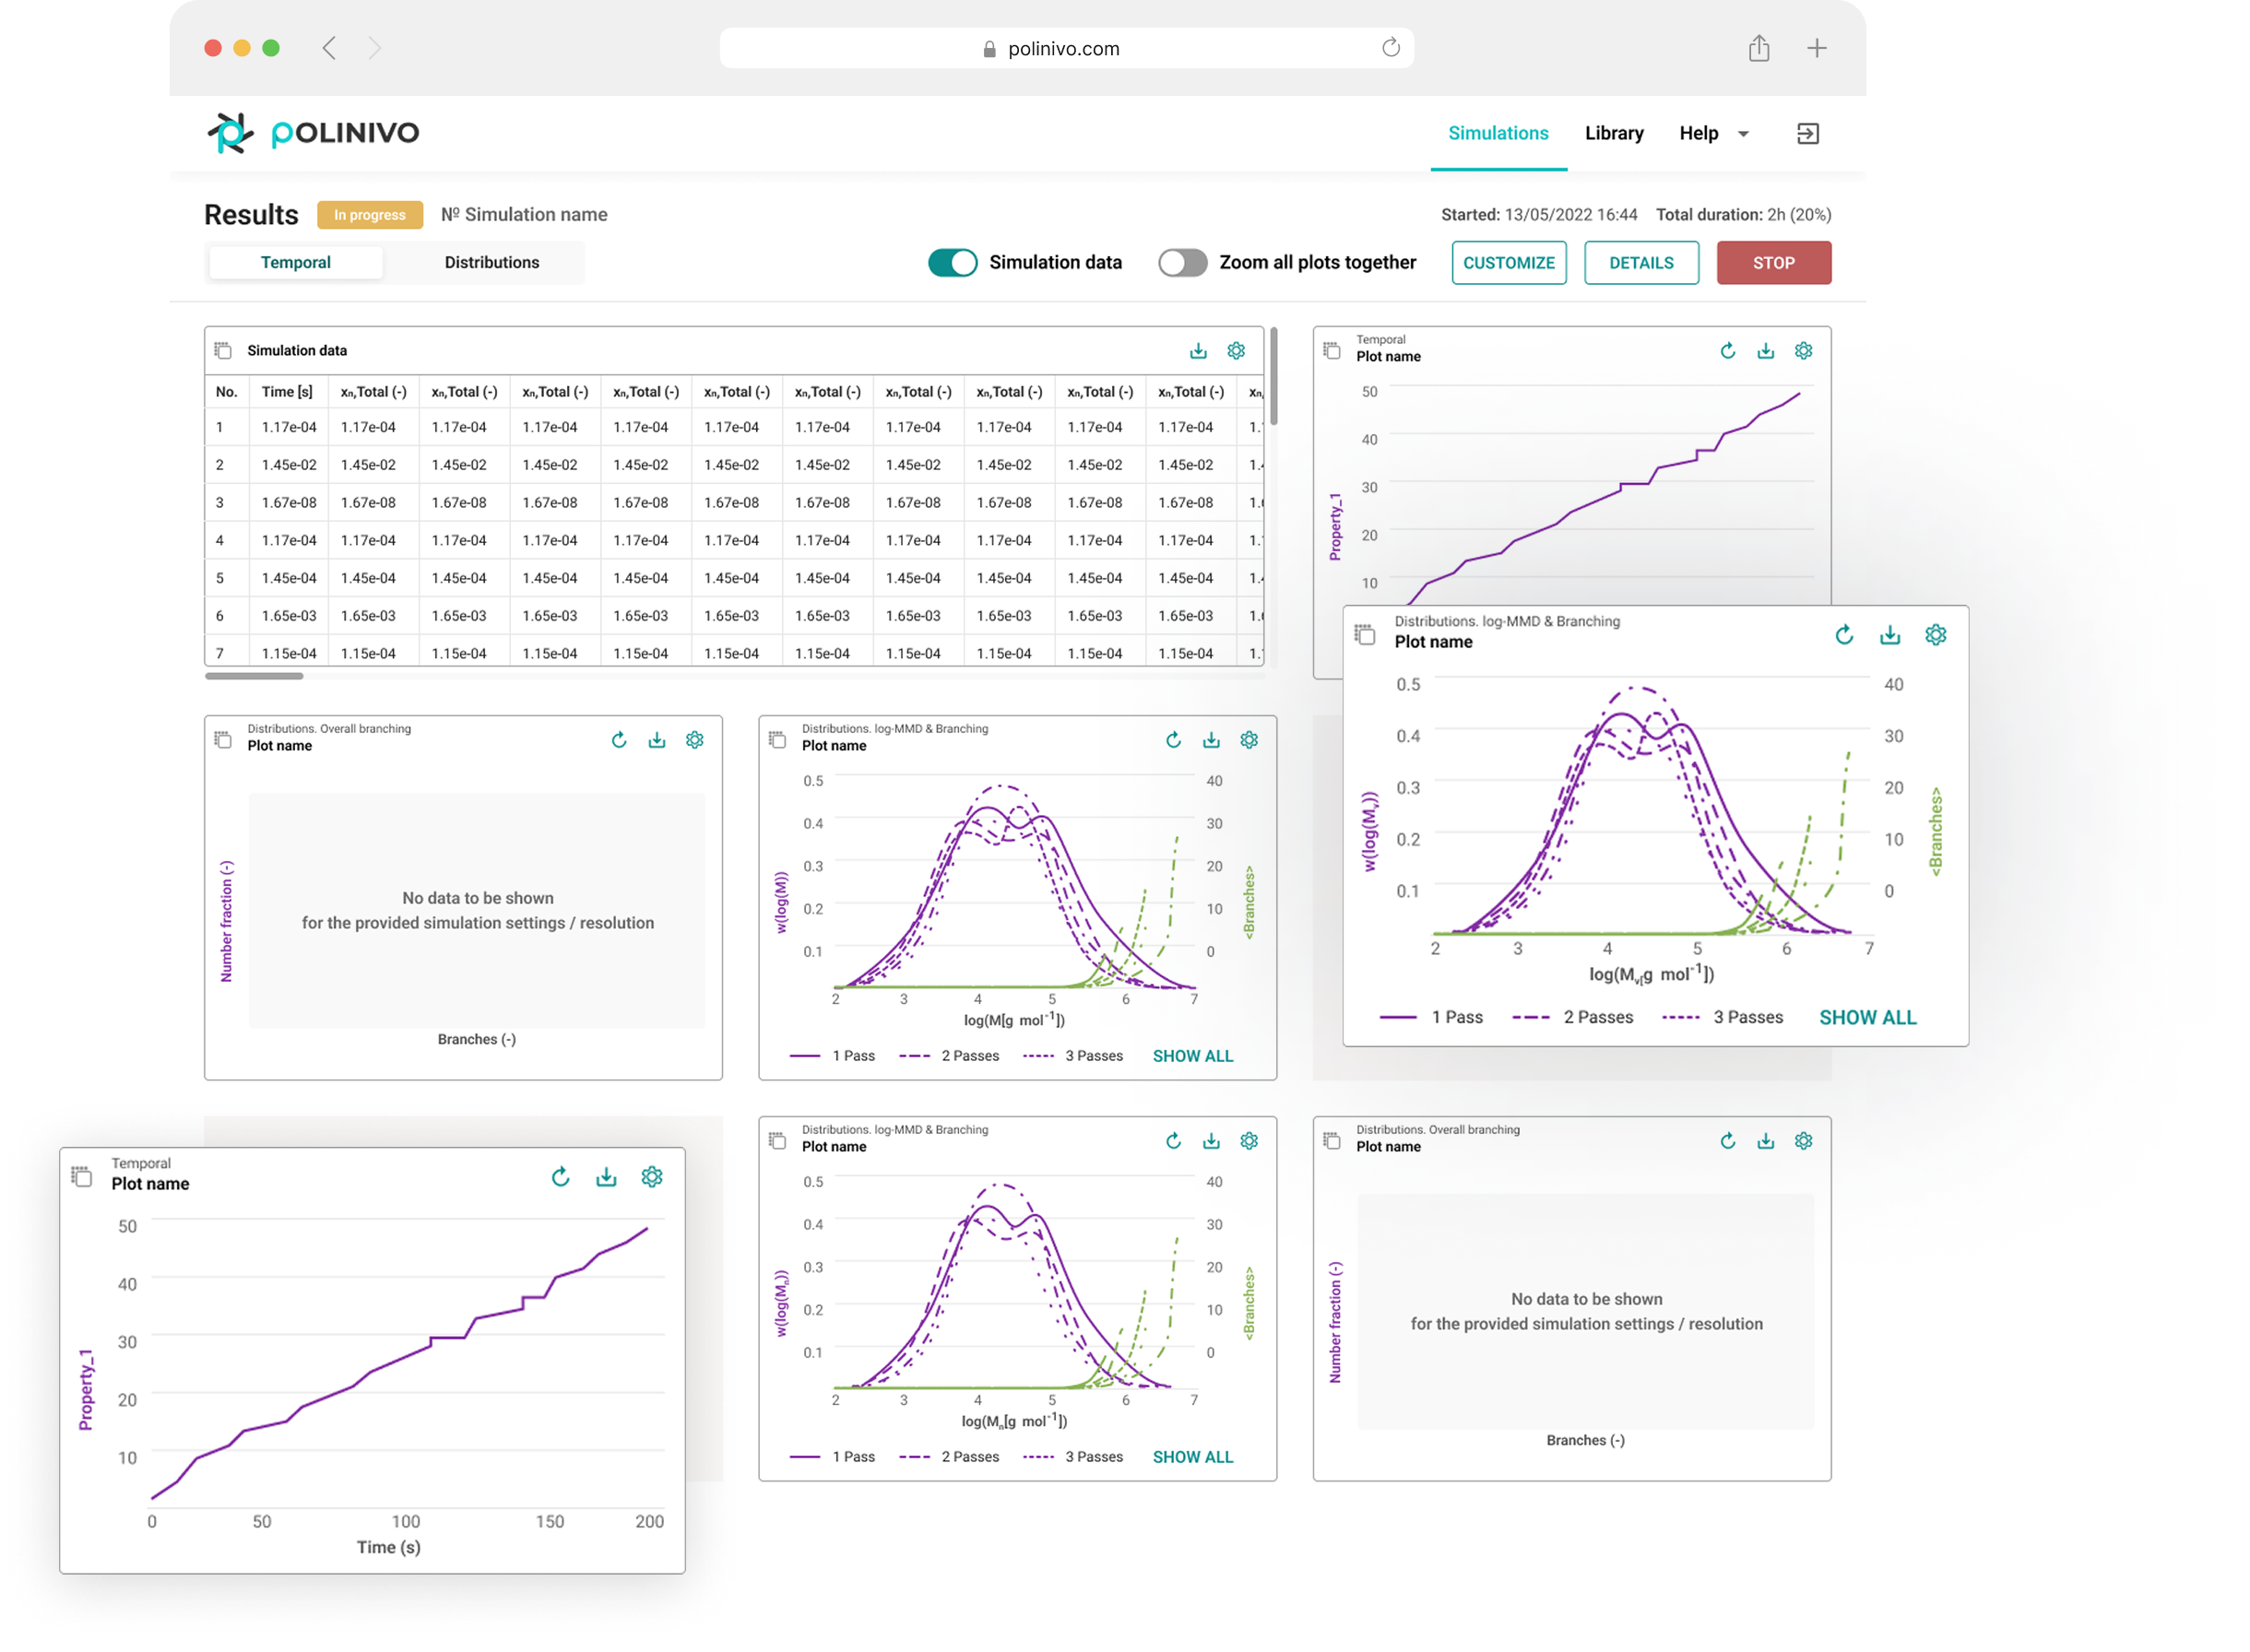
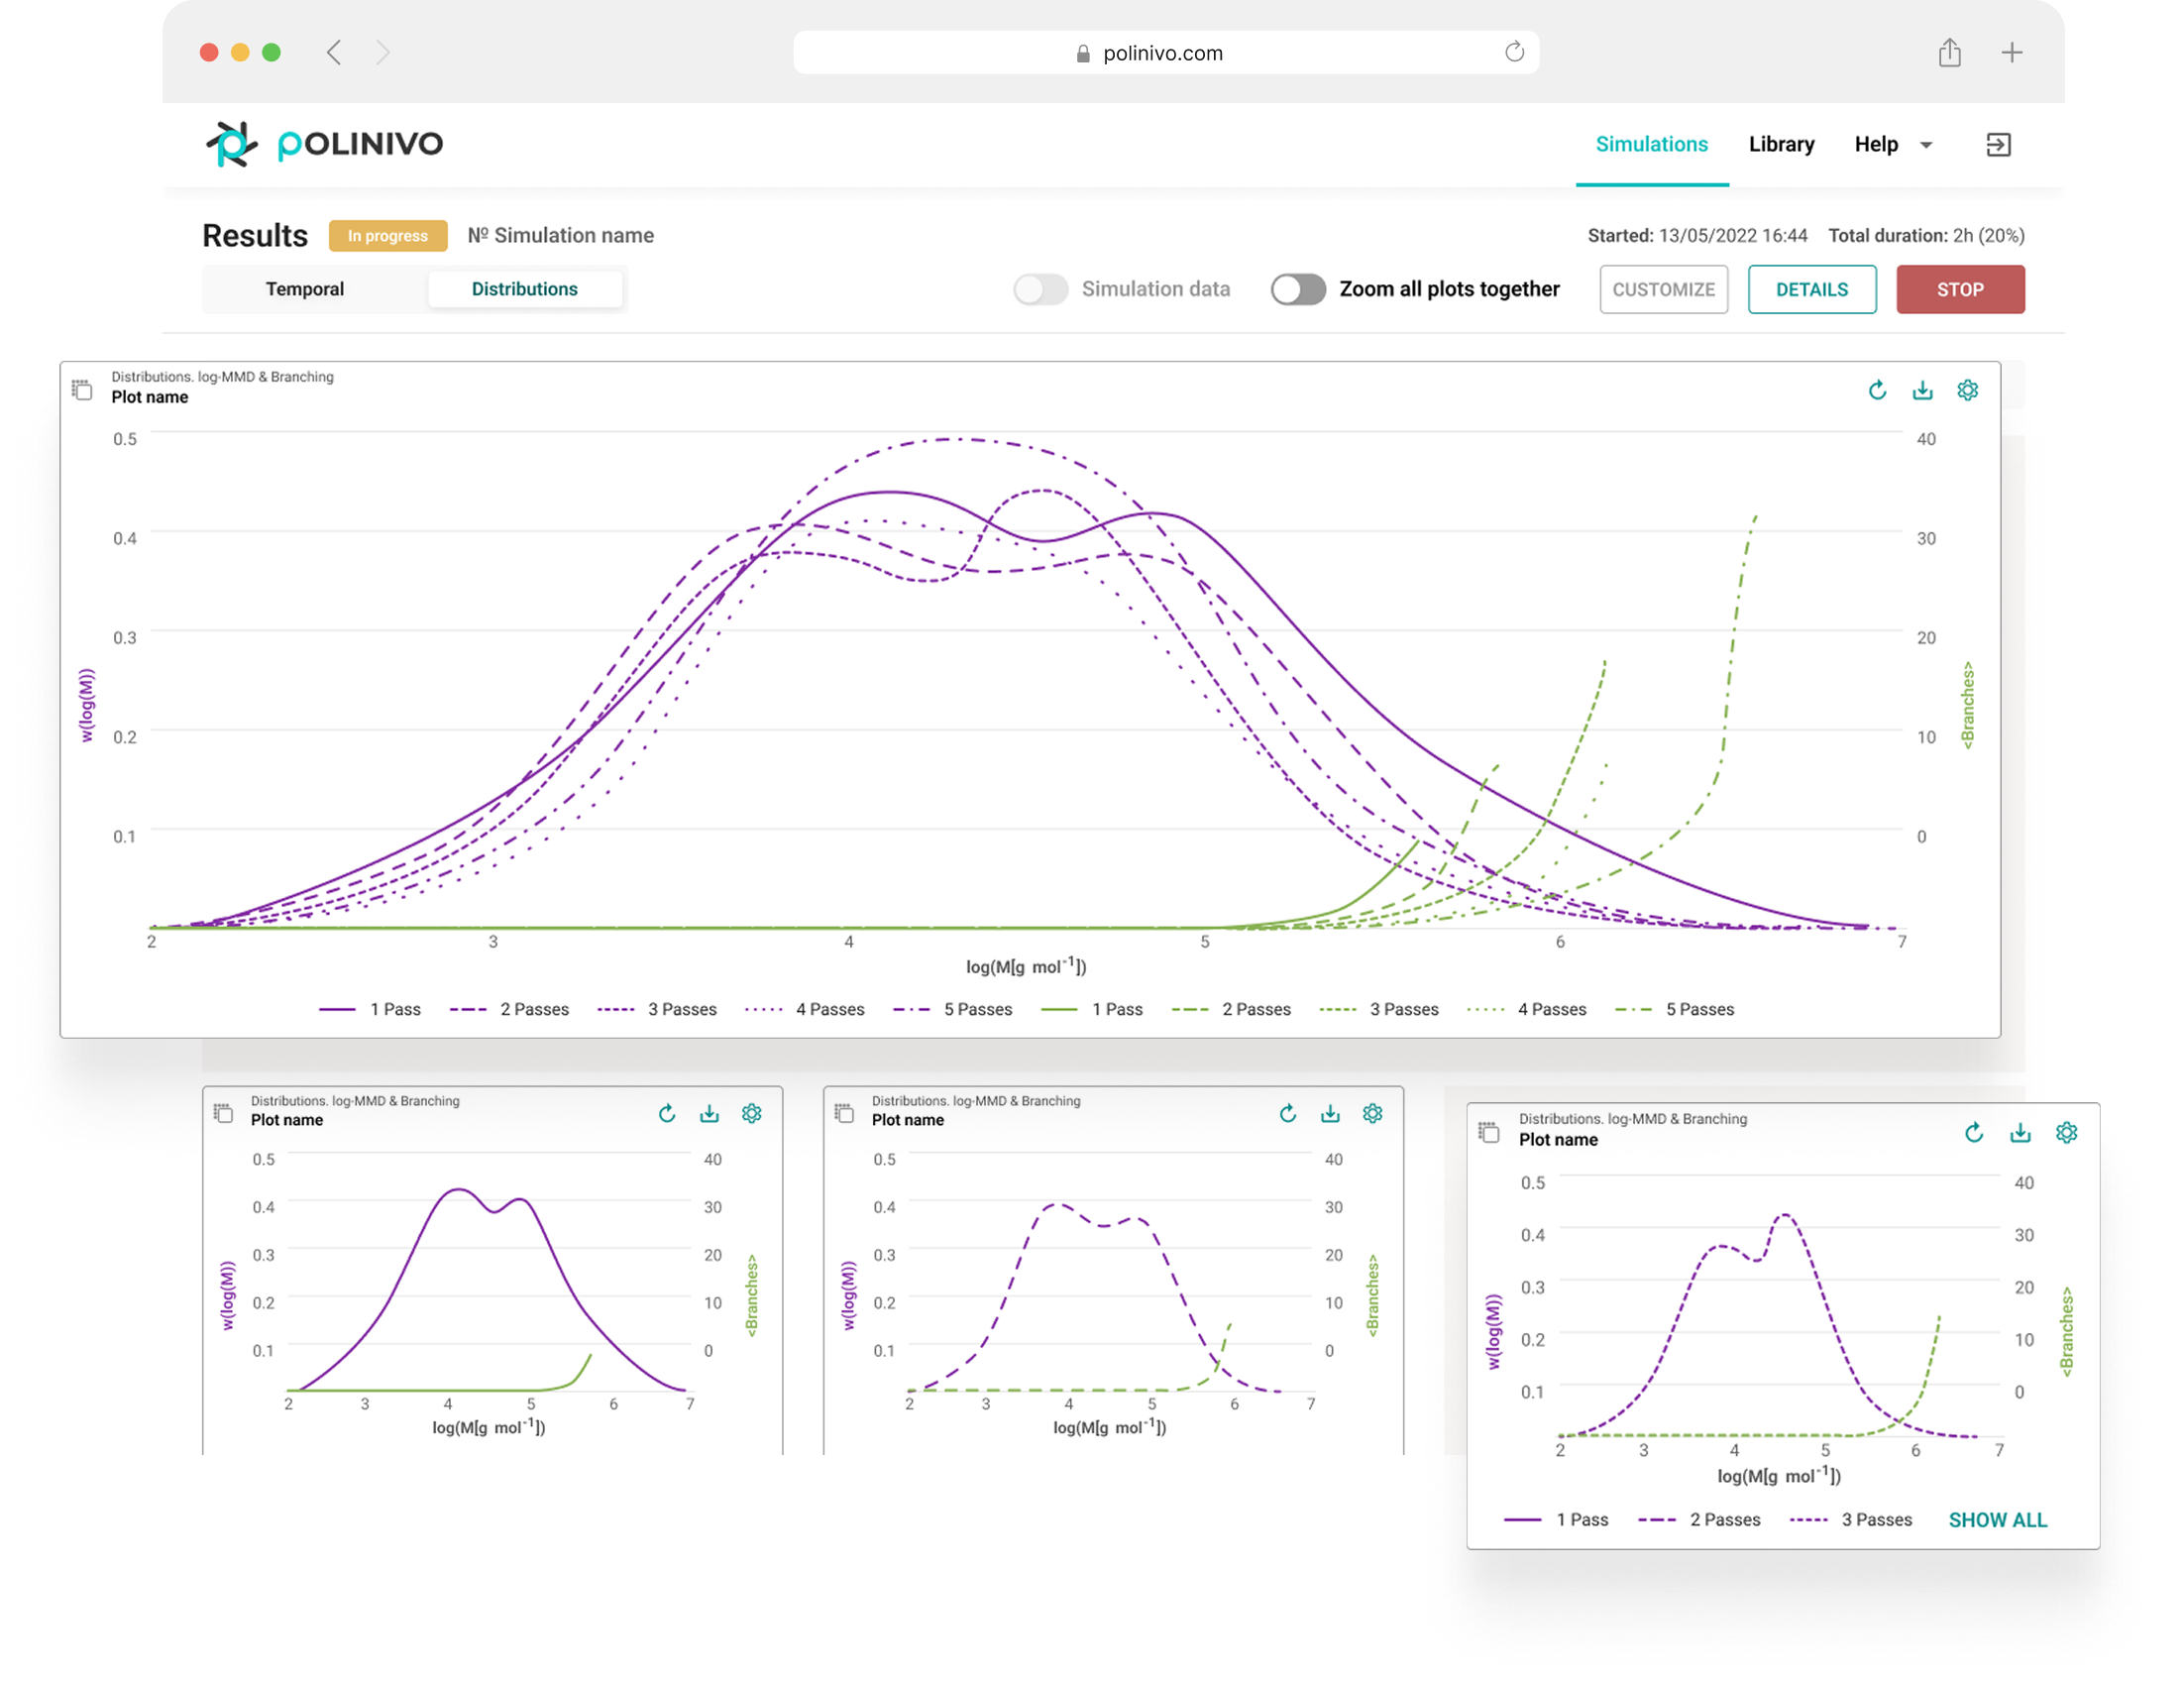
Interactive dashboard with real-time updates
We developed a result dashboard with tables and customizable charts. Users can monitor simulations in real-time, stop them early if needed, and explore different metrics through interactive plots.

project facts

main features
Real-Time Results
Users can watch simulations in real time through interactive dashboards with tables and charts. They see first results within minutes, track progress without delays, and can stop or adjust runs immediately if something looks wrong.
Dynamic Forms
Input forms change automatically based on the experiment type chosedn, polymers used, orgoals of the research thus showing only the fields that are relevant for the case.
Secure Multi-Team Access
Multiple teams or departments can work independently on the same platform, each with isolated data and configurations. Combined with two-factor authentication, this ensures high security and seamless collaboration without data mix-ups.

Technologies used